● At Level 5, students measure length, perimeter, area, surface area, mass, volume, capacity, angle, time and temperature using suitable units for these measurements in context.
● They interpret and use measurement formulas for the area and perimeter of circles, triangles and parallelograms and simple composite shapes.
● They calculate the surface area and volume of prisms and cylinders.
● Students estimate the accuracy of measurements and give suitable lower and upper bounds for measurement values.
● They calculate absolute percentage error of estimated values.
● Students use appropriate technology to generate random numbers in the conduct of simple simulations.
● Students identify empirical probability as long-run relative frequency.

Design a fair game that uses the sum or difference of two or more dice (or spinners). The only limitation is that you cannot use six sided dice (or spinners).
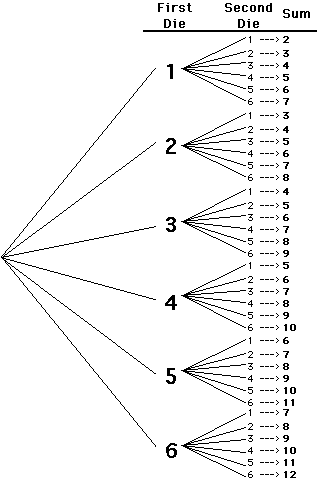
Show that it is a fair game by constructing a tree diagram and calculating the probability of each outcome as a ratio and as a decimal. You can see an example of a tree diagram for the result of two dice below.
If you don’t have access to dice or spinners, click here.
Design two surveys to ask students in the school a question. Make one to collect discrete data and one to collect continuous data. Design your survey using Google Docs. You can see my example of a discrete survey here.
Construct a stem-and-leaf plot to show your data, with the mean, median and mode identified on the stem-and-leaf plot.
Graph your results using Create-a-Graph. Identify the mean, median, range and the mode of the data. Mention what the error might be based on the range.Use Excel to sort the data.


