Design a fair game that uses the sum or difference of two or more dice (or spinners). The only limitation is that you cannot use six sided dice (or spinners).
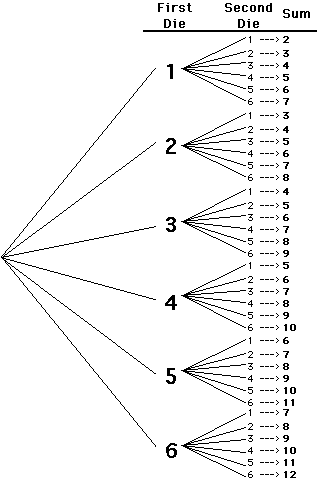
Show that it is a fair game by constructing a tree diagram and calculating the probability of each outcome as a ratio. You can see an example of a tree diagram for the result of two dice below.
If you don’t have access to dice or spinners, click here.
● understanding of the distinction between error and percentage error
● use of random numbers to assist in probability simulations and the arithmetic manipulation of random numbers to achieve the desired set of outcomes
Design two surveys to ask students in the school a question. Make one to collect discrete data and one to collect continuous data. Design your survey using Google Docs. You can see my example of a discrete survey here.
Construct a stem-and-leaf plot to show your data, with the mean, median and mode identified on the stem-and-leaf plot.
Graph your results using Create-a-Graph. Identify the mean, median, range and the mode of the data. Mention what the error might be based on the range.Use Excel to sort the data.


